
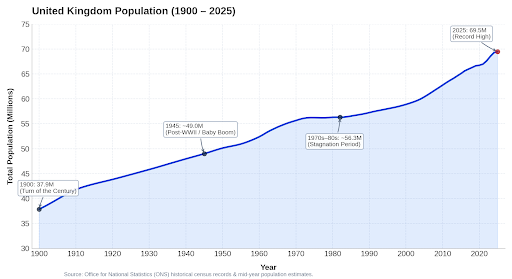
The chart above illustrates the population trajectory of the United Kingdom from 1900 to 2025, based on historical census data and Office for National Statistics (ONS) mid-year estimates.
Key Demographic Milestones
| Era / Benchmark | Population | Key Demographic Drivers |
| 1900 | ~37.9M | High birth rates balanced by high infant mortality and outward emigration to the Americas and Dominions. |
| 1911–1931 | 42.1M → 46.0M | Slower growth due to World War I casualties, the 1918 influenza pandemic, and dropping fertility during the Great Depression. |
| 1945–1970 | ~49.0M → 55.7M | Post-WWII baby boom and post-war reconstruction leading to sustained natural increase. |
| 1970s–1980s | ~56.2M → 56.4M | A distinct plateau; birth rates fell to replacement levels while net international migration remained roughly neutral. |
| 2000–2025 | 58.9M → 69.5M | Sharp re-acceleration in growth, driven predominantly by higher net migration (notably post-2004 EU expansion and post-2020 visa schemes) alongside increasing life expectancy. |
Decade-by-Decade Overview
- 1900: 37.9 million
- 1910: 41.8 million
- 1920: 43.8 million
- 1930: 45.8 million
- 1940: 48.0 million
- 1950: 50.1 million
- 1960: 52.4 million
- 1970: 55.7 million
- 1980: 56.3 million
- 1990: 57.2 million
- 2000: 58.9 million
- 2010: 62.8 million
- 2020: 66.7 million
- 2025: 69.5 million
Over this 125-year period, the UK population grew by approximately 83%, shifting from a predominantly young, industrial pyramid in the early 20th century to an aging demographic profile where modern increases are shaped primarily by international migration rather than natural change (births minus deaths).
Produced by AI Gemini.